
Poverty, Class and Intergenerational Disadvantage
Edward M. Sosu
Familial poverty and social class have a direct effect on children's future prospects in Scotland. On average, children from affluent households attain better grades in school, are more likely to go to university, occupy more prestigious positions and earn higher income than their counterparts from poorer families. In other words, inequality in income during childhood results in unequal opportunities and outcomes in later life. Previous and contemporary government policies have attempted to break this cycle with varying degrees of success. The current chapter describes the nature of poverty, social class and
'intergenerational' disadvantage. First, it examines contemporary definitions and measurements of poverty and social class, as well as rates of poverty in Scotland over time. Second, it examines the concept of intergenerational disadvantage and the mechanism by which experiences of poverty in childhood lead to poverty in adulthood. It draws on evidence from Scottish data in advancing this argument. Finally, it briefly considers some con-temporary policy responses in Scotland to breaking this cycle of disadvantage.
DEFINING POVERTY AND SOCIAL CLASS
Poverty is a complex construct and its definition has been hotly debated over the years. The British sociologist Peter Townsend proposed a relative approach to defining poverty. According to him:
Individuals, families and groups in the population can be said to be in poverty when they lack the resources to obtain the types of diet, participate in the activities and have the living conditions and amenities which are customary, or are at least widely encouraged or approved, in the societies to which they belong. Their resources are so seriously below those commanded by the average individual or family that they are, in effect, excluded from ordinary living pat-terns, customs and activities. (Townsend, 1979, p. 31)
The above definition is termed relative poverty and is currently the most widely accepted definition. It suggests that what is considered as poverty varies from one country to another due to differences in needs, social norms and time period. For in-stance, essential needs might vary from one county to another depending on variables such as weather. As such, what might be essential goods for survival in a colder climate (e.g. heating and clothing) might be different from those required to survive in warmer climates. Poverty has also been defined in absolute terms. According to the United Nations (1995), absolute pov-erty refers to 'a condition characterised by severe deprivation of basic human needs, including food, safe drinking water, sanitation facilities, health, shelter, education and information. It depends not only on income but also on access to services.' The practical implication of this definition is that eliminating poverty requires comprehensive changes to several institutional systems that determine the distribution and access to different forms of resources such as income, food, housing, education, services and information. Further complexity around the definition of poverty extends to whether individuals have or are experiencing short- or long-term poverty, income volatility, and the time at which they experience poverty in their lives. More recent discussion has also been focused on income inequality and the Scottish Government, as part of its performance targets, has committed to reducing income inequality (Scottish Govern-ment, 2016a). These different forms of poverty have recently been shown to have an impact on children's educational and employment outcomes (e.g. Schoon et al., 2011; Hardy, 2014).
Fundamentally, the way poverty is defined determines what governments and societies consider a problem, and the actions needed to reduce levels of poverty.
In the UK and many other countries around the world, poverty is measured, and by default defined, using household equivalised income. Equivalised income refers to total household income plus the value of any state benefits received minus taxes (income tax, national insurance and council tax). This is the income that is available to buy goods and services. It is then adjusted to take into account the size of the household.Governments using this approach set the poverty 'threshold' at 60 per cent of median household income. Median income is the income in the middle point if you arrange all incomes from the lowest to the highest. The poverty 'threshold' is therefore any income that is 60 per cent lower than the median income. In Scotland, individuals are said to be in relative poverty if they are living in households whose equivalised income is below 60 per cent of UK median income in that year. For instance, in 2015/16, the median income in Scotland was £24,400. After housing costs are taken into account, the poverty threshold was set at £12,900, which means that individuals with equivalised income below this amount were living in relative poverty. Scotland also produces figures for absolute poverty which takes into account inflation (see Scottish Government, 2017 for discussion on how this is computed). One of the main criticism of this approach to measuring poverty is that the 60 per cent threshold is arbitrary and simply a proxy measure which needs to be validated using direct measures of people's actual living standards (Serafino and Tonkin, 2014; Mack, 2016). However, research using these thresholds of poverty has indicated that they are directly correlated with poorer outcomes such as low educational attainment of children (e.g. Schoon et al., 2011). Advantages of this approach are that poverty rates can be tracked over time and comparisons can be made between countries (Mack, 2016).
Alternative measures of poverty have focused on the income needed for maintaining 'physical necessities' of living; these began with the work of Seebohm Rowntree in 1899. Using information from families in York and studies on the nutritional needs of prisoners in Scotland, Rowntree argued that poverty is when 'total earnings are insufficient to obtain the minimum necessaries for the maintenance of merely physical effi-ciency' (cited in Townsend, 1979, p. 33). He set out to determine a poverty threshold by estimating the average nutritional needs of adults and children, translated these needs into quantities of different foods, and then into cash equivalent. He also added minimum costs for clothing, fuel and household essentials and used the total cost to estimate the 'poverty line'. Those without sufficient income to afford these basic needs were classified as primarily poor. This approach of estimating poverty underpins the consensual method and the minimum budget standards ap-proach, which are current alternative measures of poverty (for further details see Mack, 2016). It also informs decisions on minimum income support rates that governments around the world provide to those living in poverty.
One of the key constructs that is directly linked to discourses of poverty in the UK is social class. Like poverty, social class is a complex concept that entails an individual's economic posi-tion, power, social status or prestige and culture. According to Townsend (1979, p. 370), 'class may also [refer to] segments of the population sharing broadly similar types and levels of resources, with broadly similar styles of living and some perception of their collective condition'. The acknowledgement of social class by the government in the UK dates back to 1911, when the social positions of individuals were graded based on their occupations. A variant of this approach of measuring social status nationally is still being used. Currently the Office for National Statistics in the UK provides classifications of status based on the conditions of an individual's occupation such as career prospects, autonomy, mode of payments and period of notice. Eight different social classifications are produced using this approach known as the National Statistics Socio-Economic Classification (NS-SEC). These are: higher managerial and professional occupations; lower managerial and professional oc-cupations; intermediate occupations; small employers and own account workers; lower supervisory and technical occupations; semi-routine occupations; routine occupations; never worked and long-term unemployed.
Another way in which social class has been measured is by asking individuals about their own social positions. Research in the UK (Townsend, 1979) suggests that people either place themselves in one of three main social classifications (i.e. upper, middle and working class) or a finer grouping of classes (i.e. upper, upper middle, lower middle class and so on). In 2011, the BBC in collaboration with academics undertook a survey of over 160,000 people in the UK. To determine social class, they examined people's income and assets, cultural interests and ac-tivities, and the status of their friends and business contacts.
They proposed seven classes based on this study. These are elite; established middle class; technical middle class; new affluent workers; traditional working class; emergent service workers; and precariat (Savage et al., 2013). Irrespective of the type of classifications used, there is a strong correlation between social class and levels of income. Thus, the majority of those living in poverty tend to come from lower social classifications, or tend to identify themselves as working class.
HOUSEHOLD AND CHILD POVERTY RATES IN SCOTLAND OVER TIME
Recent data indicates that about 20 per cent of the population in Scotland (1.05 million people) were living in relative poverty in 2015/16 after accounting for housing cost (Scottish Govern-ment, 2017). As can be seen in Figure 12.1, rates of poverty have fluctuated in the 1990s but fell from 25 per cent in 2000 to about 20 per cent in 2005. It remained unchanged between 2005/6 and 2009/10 before falling to 16 per cent in 2011/12. However, since then the rates have gradually risen to a current level of 20 per cent in 2015/16.
With respect to child poverty, figures in 2015/16 show that one in four children (26 per cent) were living in relative poverty after accounting for housing cost. This represents a total of 260,000 children. The trend is similar to the trajectory observed in the general population. Child poverty rates have decreased from 30 per cent in the 1990s to about 25 per cent in 2005. They remained stable until 2009/10 before falling to 19 per cent in 2011/12. However, rates of child poverty have gradually risen since then to 26 per cent in the most recent year.
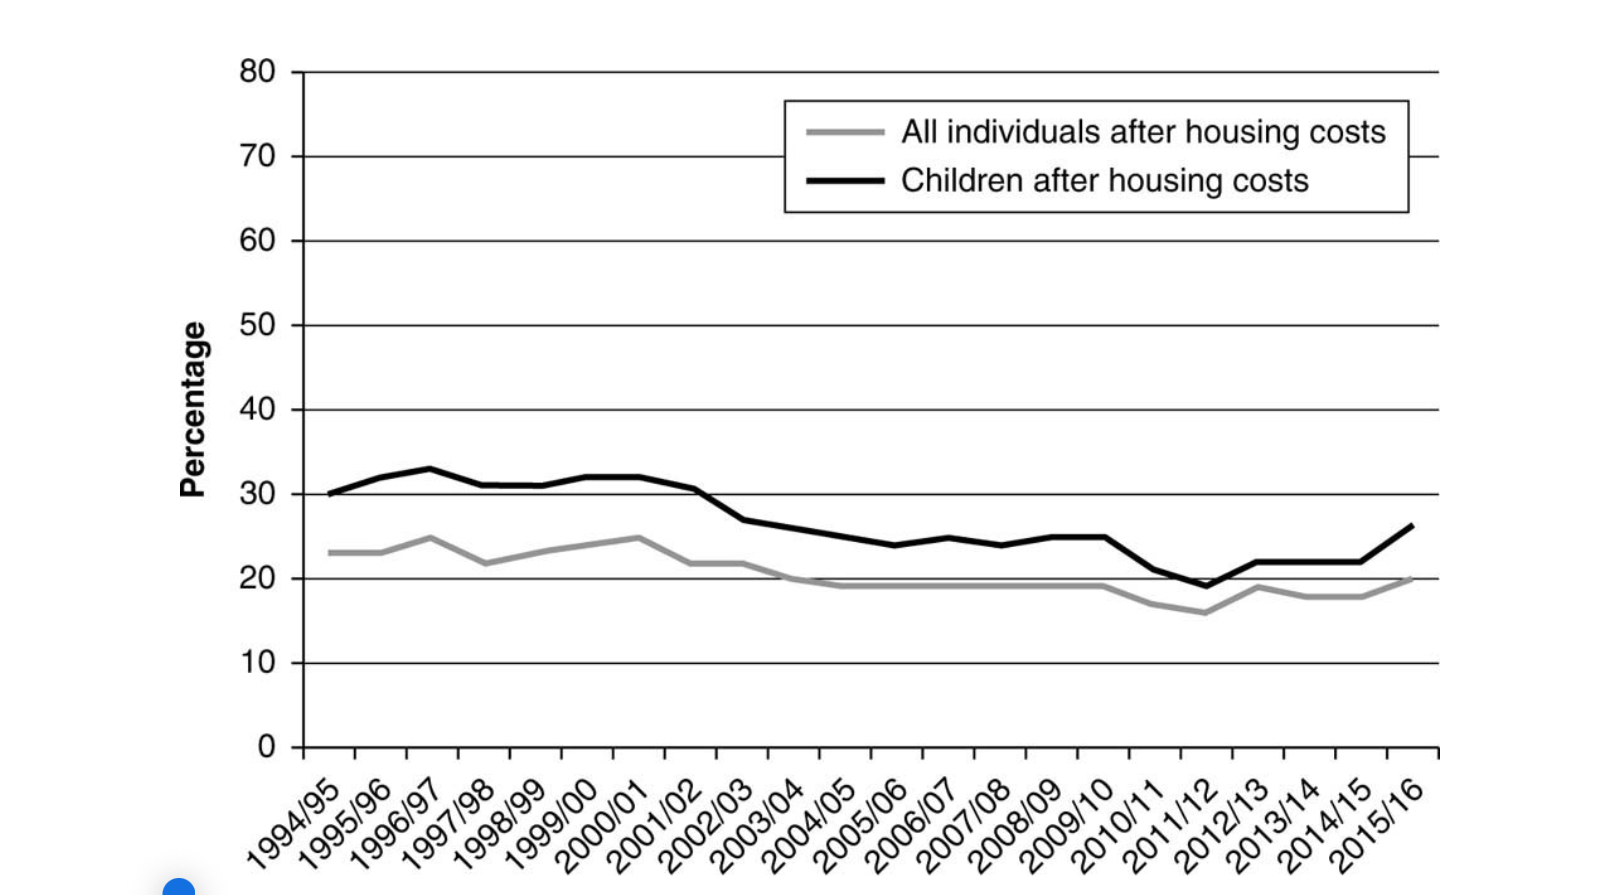 Figure 12.1 Relative poverty (below 60 per cent of UK median income in the same year) in Scottish households, 1994/5 to 2015/16